
Actomyosin ATPase cycle in solution.
We have begun to develop a comprehensive model of the ATP driven cross-bridge cycle for muscle (MUSICO). To do this we need an accurate description of the intrinsic ATPase cycle for a given myosin isoforms as defined in solution. We can then build in estimates of the effects of the 3D geometry and the load dependence of the mechano-chemical cycle. Advances in defining the cross-bridge cycle for different myosin isoforms and in the load-dependence of cross-bridge cycle events means that it is now possible to define useful tests of this modeling approach.
Modeling the complete actin.myosin ATPase cycle has always been limited by the lack of experimental data concerning key steps of the cycle such as actin binding to the M.ADP.Pi complex or the rate constant limiting Pi release. Here using the human beta-cardiac myosin-S1 we combine published data from transient and steady-state kinetics to model a minimal eight state ATPase cycle. In this ATPase cycle there are 8 intermediates defined by 9 equilibrium and 18 rate constants. Since the rate and equilibrium constants are not independent only 18 constants are required for a complete description of the cycle.
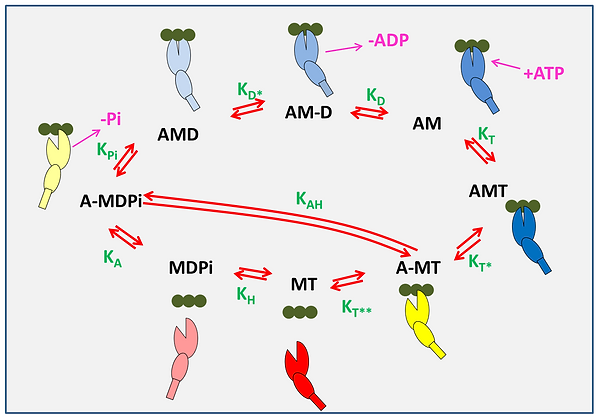
A minimal ATPase actin-myosin cycle is defined by eight states and nine equilibrium constants. The actin monomers, A, along an actin filament are shown as three green filled circles and the motor domain of myosin, M, is represent as two ellipses, the large representing the upper and lower 50 k domain with a cleft separating the two. The smaller ellipse represents the converter domain with a rectangular lever arm. The relative movements of these domains represent the structural conformations of myosin in each state. The actin-myosin cycle includes ATP binding to rigor-like complex, AM, forming the AMT state equilibrium constant for the transition = [AMT]/[AM][T]) followed by a rapid change in myosin conformation leading to the cleft opening in the A-MT state ( ) and followed by rapid detachment of actin ( ). A conformation change in the head following the opening of the 50 kDa cleft leads to the recovery stroke and hydrolysis of ATP transitioning into the MDPi state ( ). Then, the myosin can reattach to actin forming A-MDPi state ( ) and after the cleft closure, the power stroke and Pi release transitioning into an AMD state ( ) in which ADP remains firmly attached to myosin. This state allows a conformational change into the AM-D state ( ) from which ADP is released ( ) and the cycle is completed. The step labelled allows for possible hydrolysis ATP while myosin remains attached to actin. For simplicity, ATP and ADP in state labeling are denoted as T and D, respectively, inorganic phosphate as Pi, and a hyphen indicates relatively weak association between the species. The equilibrium constants between the states are denoted in green letters and represent a ratio between forward (clockwise) and reverse state transition rate constants. Note the nomenclature for rate and equilibrium constants uses the subscript (A, D, Pi, T) to indicate the species binding or released from myosin in each order step. A star (*) indicates that it is an isomerisation event linked with the order binding or dissociation event. The only exception is and which are the ATP hydrolysis steps with or without actin attached.
For quantitative analysis of the ATP-ase data we have developed a computational model for minimal 8-step ATPase cycle and used published values and estimates of all the constants available and fitted the remaining constants to the published and values for the ATPase. These allowed us to compare the occupancy of different states in the cycle as a function of actin concentration, and to predict the maximum velocity of contraction/in vitro motility (d*ATPase/duty ratio) and the number of strongly attached heads in the steady-state.

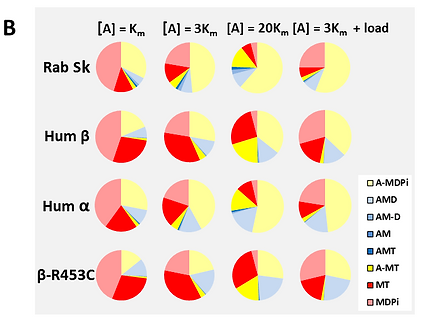
The details of the fit to the ATPase data: (A) and the state occupancy of intermediates in the ATPase cycle (B) for four muscle myosin isoforms. A) The dependence of the ATPase cycle on actin concentration and B) the occupancy of each of the intermediates in the ATPase cycle at three different actin concentrations [A] = , 3 and 20 corresponding to 0.5, 0.75 and 0.95 of . The simulation data also include predictions for how the state occupancy would change for the [A] = 3 conditions (see arrows in A) if the actomyosin system were loaded such that the isomerization steps controlling both Pi and ADP release were reduced by a factor of 3.
The simulations provided excellent fits to the ATPase data for all isoforms studied. Error analysis suggests that errors of greater than 20 % in any of the fitted rate or equilibrium constants are very unlikely. This translates into smaller errors in the populations of states (Mijailovich et al., 2017)
Population analysis reveals differences in the 3 muscle isoforms showed: (1) β S1 cycles more slowly and predicts a velocity ~20% of the fast skeletal isoform. -S1 lies between the two, as expected from muscle fiber studies. (2) Duty ratios of fast skeletal and β are similar and significantly higher (~30%) for a myosin; (3) The effect of a 5pN load on the cycle has similar effects on the ATPase rate and velocity in each case (55-60% reduction) but the change in duty ratio is very different; (4) Fast skeletal and a myosin isoform have a small load induced change in Duty Ratio (+10% & -7% respectively). In contrast load increases Duty Ratio by 26% for β-cardiac. This indicates a markedly different response to load for the three mechano-chemical cycles, consistent with the high efficiency force generation of the slow β-isoform.
Regulated Actomyosin ATPase cycle: We are currently developing computational tools for extracting the model parameters from in solution data. The model simulations will define the equilibrium between the 3- thin filament states ( – Closed/blocked & = Open/closed), the dependence of these parameters, the binding and release rate constant from cTnC and subsequent increase in cTnC-cTnI interaction in the thin filament. The methods for measuring these parameters are well established in the Geeves and Regnier laboratories. The parameters obtained will be used within MUSICO to predict the regulation of the steady-state ATPase cycle as has been done for the human skeletal muscle system. Repeating this work for proteins in different species will allow us to provide a complete data set for inclusion in the sarcomeric model and to predict the dependence of both steady state and transient measurements. Measures of cTn binding and cTnC-cTnI interaction will be augmented with molecular dynamics (MD) modeling for correlative structural analysis.